AddGridLines
洛 2023/1/10
# AddGridLines(LONRange = (-180, 180, 15), LATRange = (-90, 90, 15), ShowLON = True, ShowLAT = True, LineColor = 'gray', LineStyle = (0, (6, 6)), LineWidth = 0.3)1.1.2 +
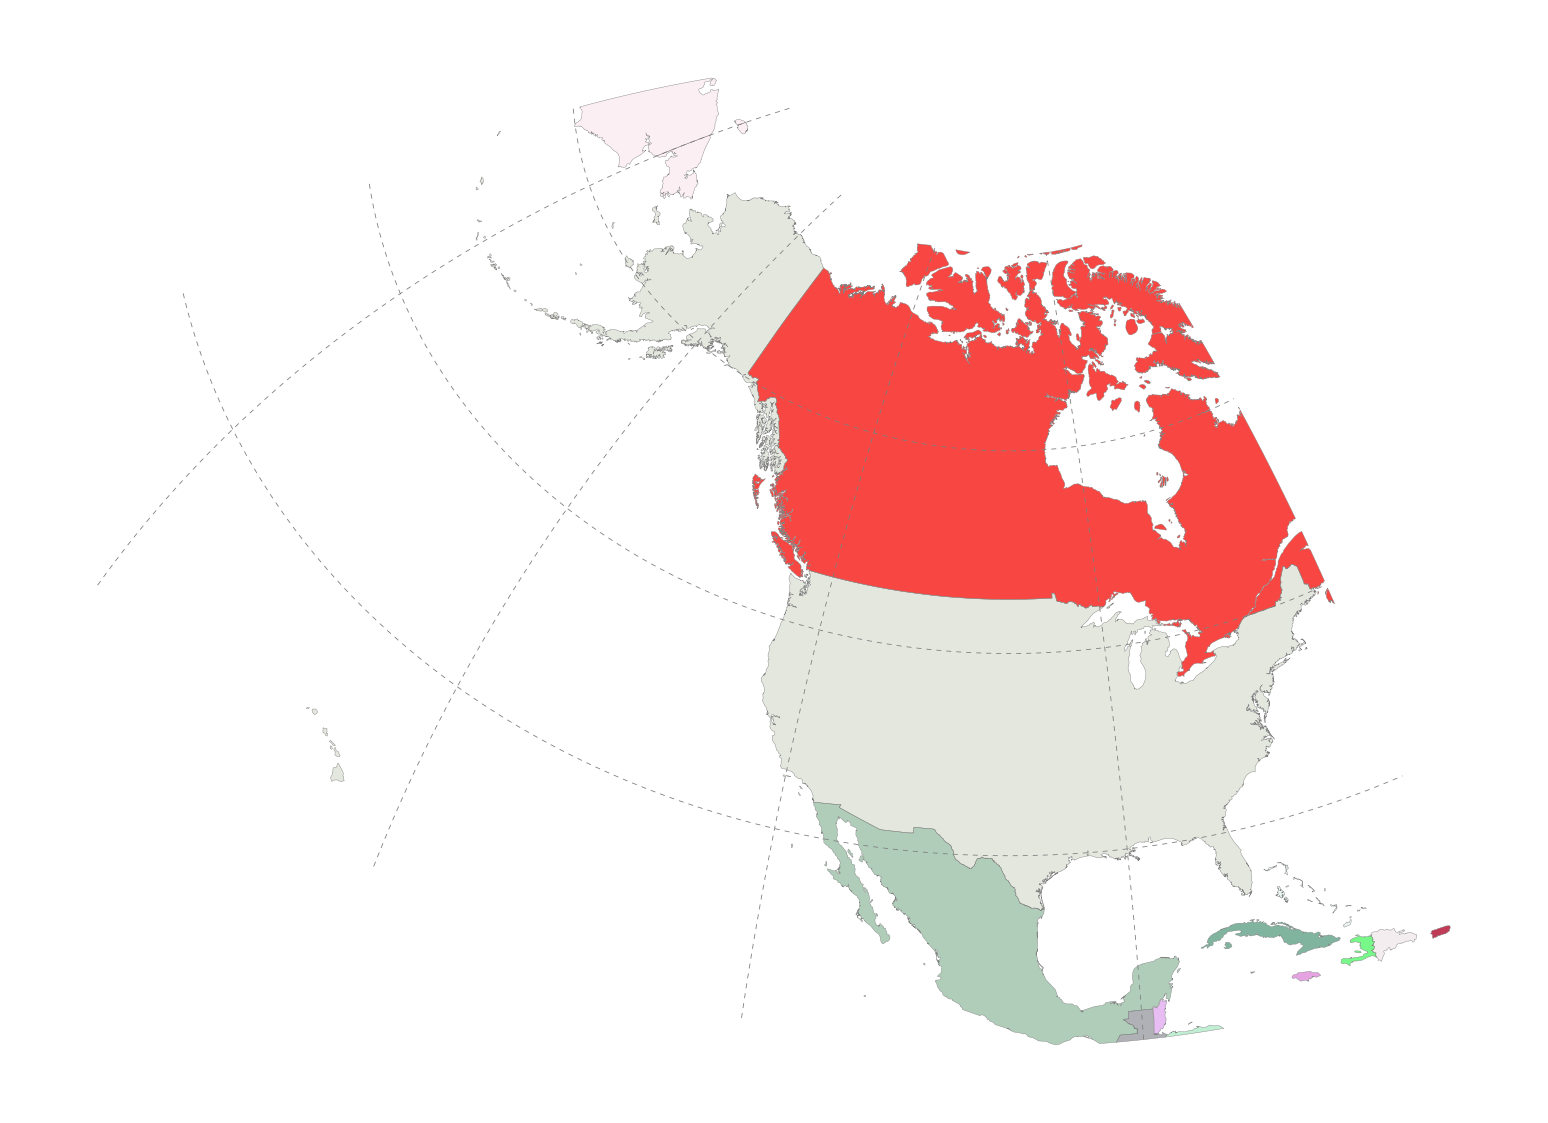
功能: 【添加经纬网】。在地图框中添加经纬网。
可选参数:
LONRange = tuple。生成经纬网的初始经度、结束经度和间隔。 默认 (-180, 180, 15)。
LATRange = tuple。生成经纬网的初始纬度、结束纬度和间隔。 默认 (-90, 90, 15)。
ShowLON = tuple。是否显示经度网。 默认显示(True)。
ShowLAT = tuple。是否显示纬度网。 默认显示(True)。
LineColor = str||tuple。经纬网线颜色。如果为 None,则生成随机颜色。详见:matplotlib。
LineStyle = str||tuple。经纬网线样式。详见:AddLayer 中 LineStyle。
LineWidth = float。线宽。默认 0.3。
返回:list。经度网和纬度网 gma.map.feature.PlotFeature 列表。
示例:
from gma.map import plot, inres

# 初始化地图框,并添加一个图层
MapF = plot.MapFrame(BaseMapProj = 9311, Extent = None)
MapL1 = MapF.AddLayer(inres.WorldLayer.Country, FaceColor = None, LineColor = 'gray', LineWidth = 0.1)

# 添加经纬网
Grid = MapF.AddGridLines(LONRange = (-180, 180, 30), LATRange = (-90, 90, 15), LineWidth = 0.2)
1
2
3
4
5
6
7
8
2
3
4
5
6
7
8

