初始化
洛 2023/1/10
# gma.map.plot.MapFrame(Axes = None, BaseMapProj = 'WGS84', Extent = None)1.1.2 +
功能: 【类】。初始化一个地图框。
初始化:
Axes = None||matplotlib.~.AxesSubplot。一个 matplotlib 子图。默认(None)自动创建子图。
BaseMapProj = str||EPSG||WKT||Proj4||SpatRef||... 。底图坐标系,默认为 WGS84。
提示
后续添加的所有数据都会被重投影到此坐标系。
Extent = tuple 。WGS84 坐标系下的绘图范围(左、下、右、上)。默认为底图坐标系所支持的最大范围。
已包含的类方法/属性:
| 序号 | 名称 | 描述 | 类型 |
|---|---|---|---|
| M.1 | AddLayer | 添加图层(可以重复添加多个图层) | 方法 |
| M.1.1 | AddLabel | 添加 图层/要素 标注,为 layer /feature 模块相关子类的功能 | 子类方法 |
| M.2 | AddFeature | 添加要素(可以重复添加多个要素) | 方法 |
| M.3 | AddCompass | 添加指北针 | 方法 |
| M.4 | AddGridLines | 添加经纬网(仅经纬网线) | 方法 |
| M.5 | AddLegend | 为绘制的矢量图层、重分类或唯一值栅格数据集添加图例 | 方法 |
| M.6 | AddScaleBar | 添加比例尺 | 方法 |
| M.7 | AddDataSetClassify | 添加重分类栅格数据集图层 | 方法 |
| M.8 | AddDataSetDiscrete | 添加离散型栅格数据集图层 | 方法 |
| M.9 | SetBackground | 设置背景颜色 | 方法 |
| M.10 | SetFrame | 设置地图框(包括刻度和经纬度的标注等) | 方法 |
| P.1 | Axes | <matplotlib.axes._subplots.AxesSubplot>。matplotlib 子图,可按需补充调整 | 属性 |
| P.2 | BaseMapProj | <gma.map.rcs.SpatRef> 。底图坐标系(已初始化为空间参考) | 属性 |
| P.3 | FrameFeature | <gma.algos.dataio.veds.Feature> 。地图框 Feature(ProjWKT) | 属性 |
| P.4 | GridLines | list 。经度网 / 纬度网 ->(gma.map.feature.PlotFeature) | 属性 |
| P.5 | PlotX | list。所有绘制图层的返回值 | 属性 |
| P.6 | WorldFeature | <gma.algos.dataio.veds.Feature> 。底图的最大范围 Feature(WGS84) | 属性 |
示例:
from gma.map import plot
MapF = plot.MapFrame(BaseMapProj = 9311, Extent = None)
1
2
2
>>> <gma.map.layout.MapFrame at 0x......>
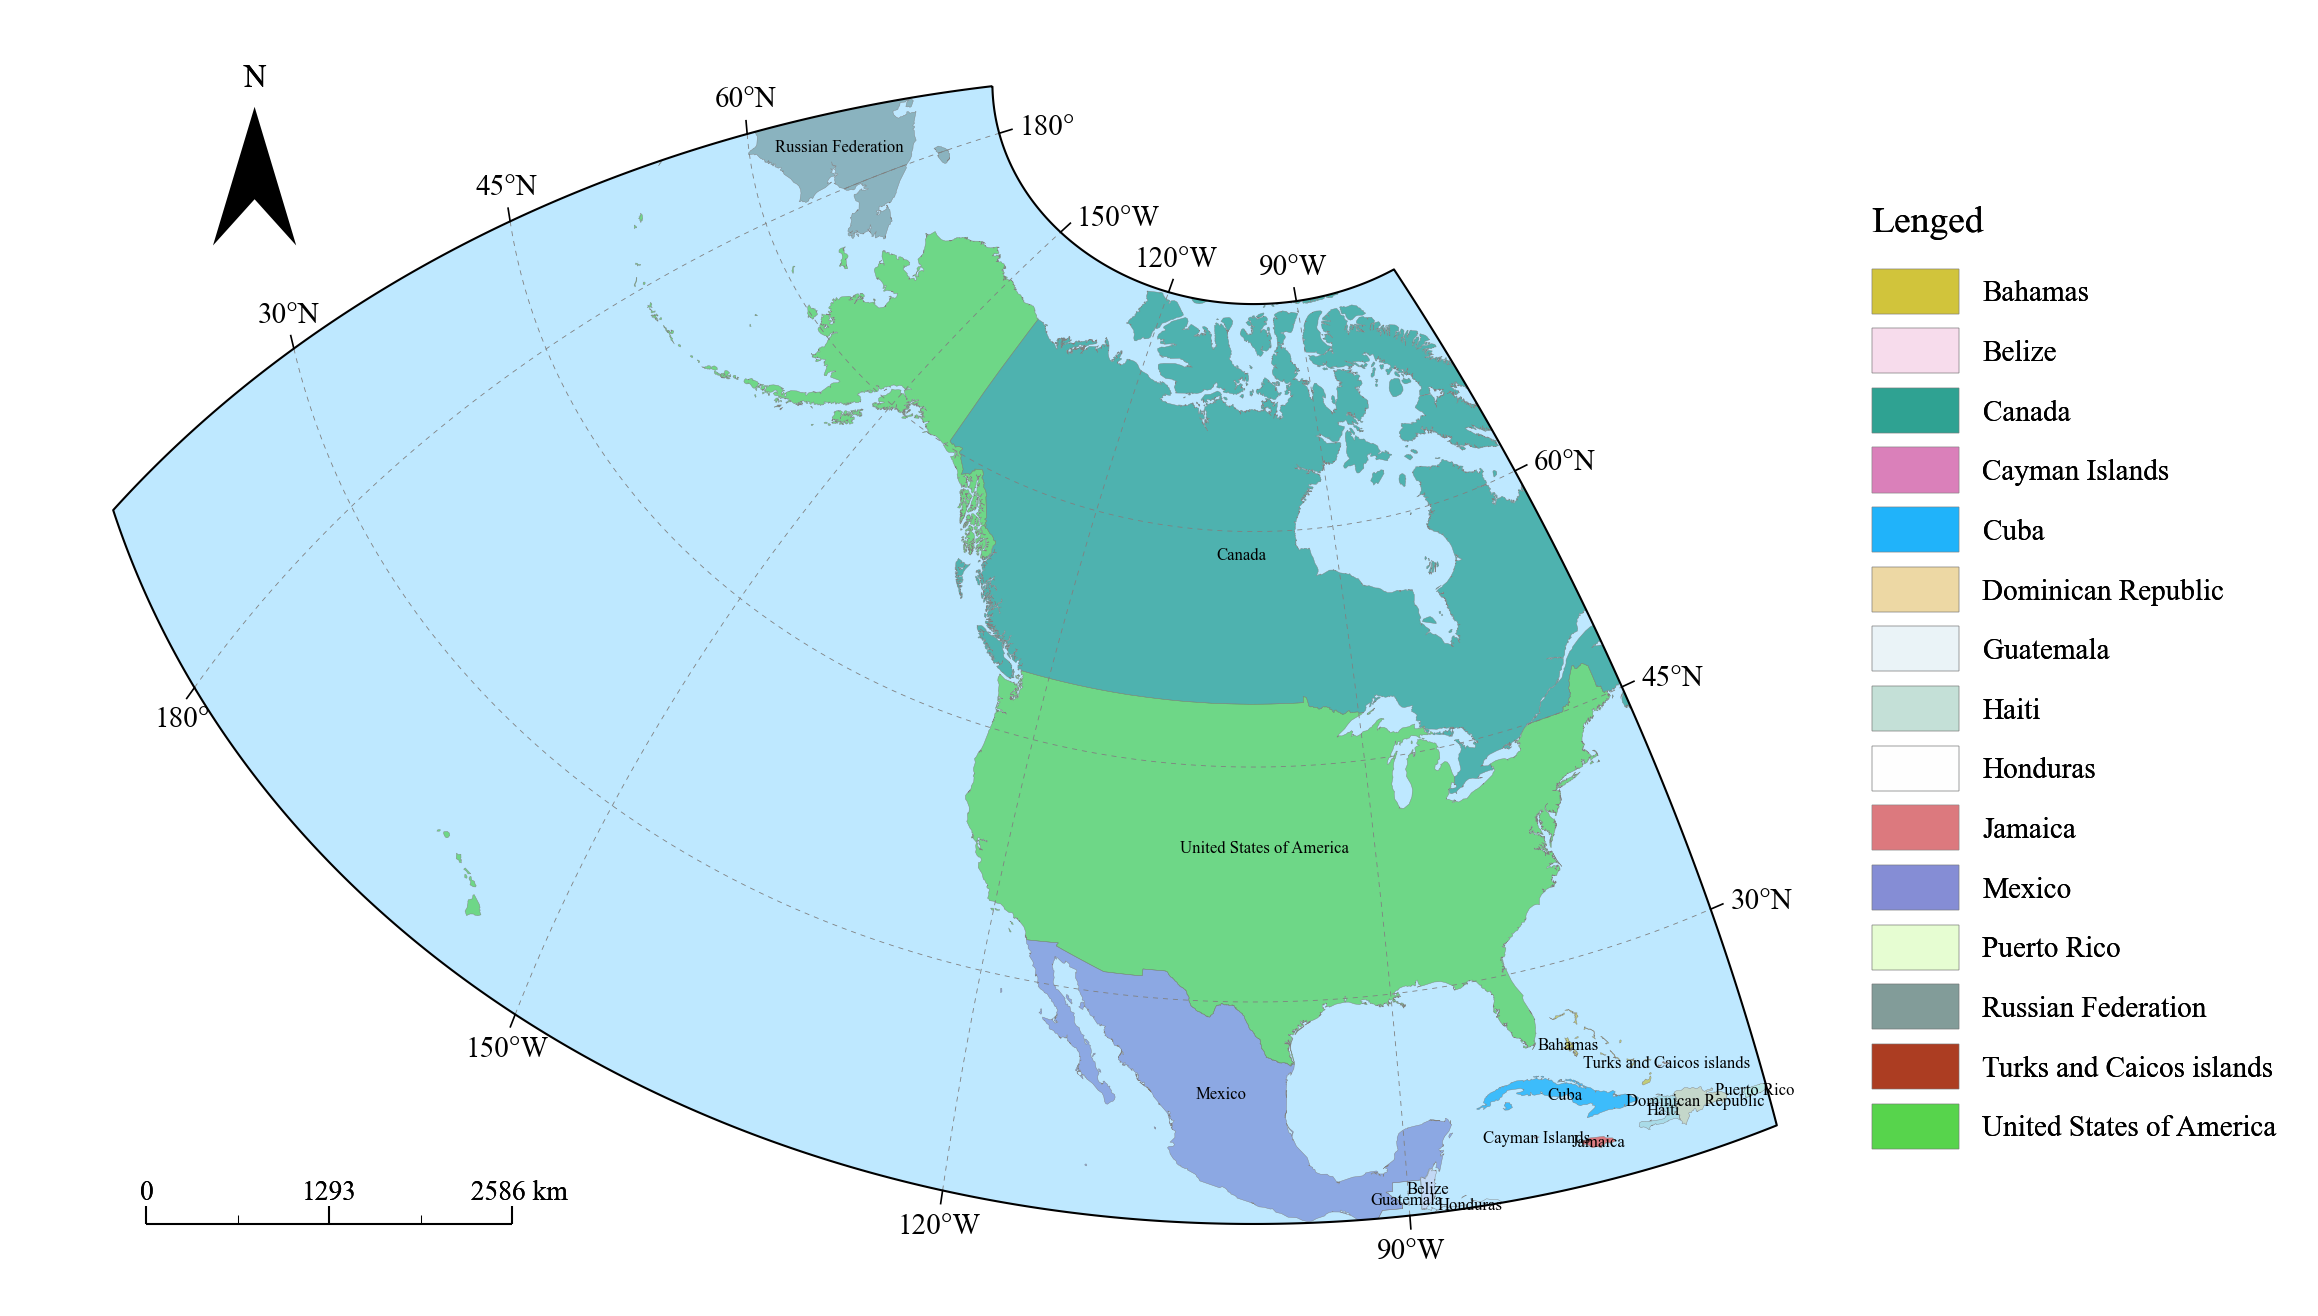
绘图流程的简单示例:
from gma.map import inres, plot
MapF = plot.MapFrame(BaseMapProj = 9311, Extent = None)

# 1.添加图层(可以重复添加多个图层)
MapL1 = MapF.AddLayer(inres.WorldLayer.Country, FaceColor = None, LineColor = 'gray', LineWidth = 0.1)
## 1.1 为此图层添加标注(标注属性表 'Name' 列)
MapL1.AddLabel(FieldName = 'Name', FontSize = 4)

# 2.添加经纬网
Grid = MapF.AddGridLines(LONRange = (-180, 180, 30), LATRange = (-90, 90, 15), LineWidth = 0.2)

# 3.设置地图框(包括刻度和经纬度的标注)
Frame = MapF.SetFrame(FrameWidth = 0.5, LabelFontSize = 7, TickLength = 0.008)

# 4.设置底图颜色
Background = MapF.SetBackground(Color = '#BEE8FF')

# *5.地图整饰要素
## 5.1 添加指北针
Compass = MapF.AddCompass(LOC = (0.06, 0.86), Width = 0.05, Color = 'black')
## 5.2 添加比例尺
ScaleBar = MapF.AddScaleBar(LOC = (0.02, 0), Width = 0.22, Color = 'black')
## 5.3 添加图例
Legend = MapF.AddLegend(LOC = (1, 0.1), NColumns = 1, TitleAlignment = 'left')
1
2
3
4
5
6
7
8
9
10
11
12
13
14
15
16
17
18
19
20
21
22
23
24
2
3
4
5
6
7
8
9
10
11
12
13
14
15
16
17
18
19
20
21
22
23
24