User-Friendly First
Built on Python, with a clear guide for quick start.
Open and Shared
Over 100 functions are available for open use.
Efficient Updates
Continuously optimized for peak performance.
Quick Start
Install(bash)
pip install gma
Import(IDE)
## Import selected modules
from gma import climet, crs, driver, gio, math, rsvi, smc, etools, env, const

## Spatial plotting and built-in data
from gma.carto import plot, inres
Plotting (Example)
from gma.carto import plot, inres
from gma import crs
import matplotlib.pyplot as plt
import numpy as np

fig = plt.figure(dpi = 300)
ax = fig.add_subplot()

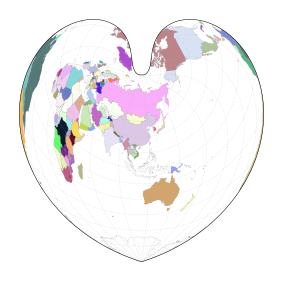
# Create a Bonne projection coordinate system with a central meridian of 112°E
proj = crs.ProjectedCoordinateSystem(proj_method = crs.ProjMethods.Bonne(central_meridian = 112))

# 0. Create a map frame for cartography
mf = plot.MapFrame(ax = ax, crs = proj)

# 1. Add built-in world country and administrative boundary vectors
xly = inres.WorldLayer.Country
np.random.seed(4)
colors = np.random.uniform(size = (len(xly), 4))

ml1 = mf.add_vector(xly, facecolors = colors, edgecolors = 'gray', linewidths = 0.1)

# 2. Add graticules
gtl = mf.add_graticule(lon_range = range(-180, 180, 30), lat_range = range(-90, 90, 15),
                       linewidths = 0.2, ls = (6, (6, 6)))
# 2.1 Set the graticule frame border
ol = gtl.set_outline(linewidths = 0.5)